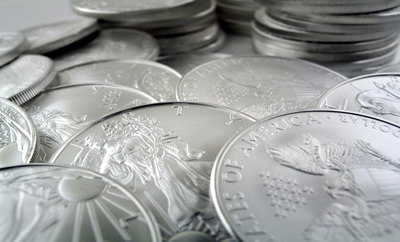
Ending Annual Sales Record for 2013 American Eagle Silver Coins
January 7, 2014 by Darrin Lee Unser · Leave a Comment
2013 was an interesting year when it comes to silver as bullion sales of American Eagle silver coins shattered a yearly record despite the market realizing its biggest annual decline in almost a third of a century.

The annual sales record for the 2013 American Eagle silver coins ended at 42.675 million
The contradicting numbers show investors are still willing to bank on silver as a long-term investment option even in a depressed market.
2013 American Silver Eagles tallied up an annual sales total of 42,675,000 coins. The final number pole-vaulted the year into the number one position, jumping over the previous record set two years earlier by more than 2.8 million coins.
Top 5 Bullion Sales Years for American Eagle Silver Coins
| Rank | Year | Annual Sales |
| 1 | 2013 | 42,675,000 |
| 2 | 2011 | 39,868,500 |
| 3 | 2010 | 34,662,500 |
| 4 | 2012 | 33,742,500 |
| 5 | 2009 | 28,766,500 |
The annual sales record happened in the face of a sales suspension early in the year and a rationing program which followed. A United States Mint allocation program limited the number of American Silver Eagles that could be ordered by purchasers and it lasted throughout 2013. In addition, sales of the silver coins were put to an end on December 13, 2013 when the last were issued, allowing the US Mint time to build inventories for the initial 2014 orders to start on January 13, 2014.
In spite of all the throttling, demand for 2013 American Eagle silver coins still powered sales to remarkable and consistently high monthly levels. January 2013 ranks as the best month ever with sales of 7,498,000. More telling, the top twenty sales months since the American Silver Eagles debuted in 1986 include eight from 2013.
Other Sales of 2013 US Mint Silver Bullion Coins
Demand for 2013 America the Beautiful Five Ounce Silver Bullion Coins also surged. Featuring unique, one-year only designs, all five of the year’s silver coins attained sell-outs.
Bullion Sales of 2013 America the Beautiful Silver Coins
| Total Sales | Sold-Out Date | |
| 2013 White Mountain 5 Ounce Silver Bullion Coins | 35,000 | Sept. 11, 2013 |
| 2013 Perry’s Victory 5 Ounce Silver Bullion Coins | 30,000 | Dec. 10, 2013 |
| 2013 Great Basin 5 Ounce Silver Bullion Coins | 30,000 | Dec. 10, 2013 |
| 2013 Fort McHenry 5 Ounce Silver Bullion Coins | 30,000 | Nov. 19, 2013 |
| 2013 Mount Rushmore 5 Ounce Silver Bullion Coins | 35,000 | Nov. 22, 2013 |
It should be noted that these numbers represent significant increases from the 2012 coins that saw final mintages ranging from 20,000 – 25,400. It also took until March 1, 2013 for the last of the 2012 ATB silver coins to sell from the US Mint’s inventory, whereas the last of the bullion 2013 ATB silver coins sold out on December 10, 2013.
In annual sales, the Mint moved a total of 223,100 ATB silver bullion coins in 2013 compared to 118,100 in 2012.
2013 Silver Market Fluctuations
2013 marked a sharply lower trading year for silver with futures tumbling 35.9%, the most since 1981. The loss was an aggregate of the performance of the precious metal throughout the year with a majority of the twelve months ending lower.
2013 Silver Futures Gains and Losses
| Monthly Increase / Decrease | |
| January 2013 | +3.7% |
| February 2013 | -9.3% |
| March 2013 | -0.4% |
| April 2013 | -14.6% |
| May 2013 | -8% |
| June 2013 | -12.5% |
| July 2013 | +0.8% |
| August 2013 | +19.8% |
| September 2013 | -7.7% |
| October 2013 | +0.7% |
| November 2013 | -8.4 |
| December 2013 | -3.3% |
As shown in the chart, eight of the twelve months ended with declines leaving only four in positive territory.
![[Most Recent Quotes from www.kitco.com]](http://www.kitconet.com/images/quotes_2a.gif)


