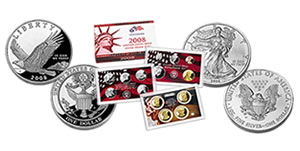
Silver Coin Demand Fluid, US Mint Sales Figures Show
July 2, 2009 by Silver Coins Today · Leave a Comment
 In typical fashion of late, the demand for US silver coins and sets flows differently depending on the week, with both ups and downs.
Of the six silver products sold, the latest US Mint sales figures have four with modest increases and two easing lower.
The down shifters were:
- DC & US Territories Quarters, gaining 6,173 more compared to the prior week’s 6,491
- Uncirculated Braille Silver Dollars in the easy-open capsule, gaining 102 versus the prior 191
The following table has the latest silver coin stats:
U.S. Mint Silver Coin Sales Stats
(Sales compare previous to current Mint figures)
|
Previous Sales
|
New Sales
|
Unit Increase
|
% Increase
|
Mintage Limit
|
|
| 2008 American Eagle Silver Dollar Proof* |
713,353
|
713,353
|
0
|
0.00%
|
none
|
| 2008 American Eagle Silver Dollar Uncirculated* |
444,558
|
444,558
|
0
|
0.00%
|
none
|
| 2009 Lincoln Silver Proof* | 325,000 | 325,000 | 0 | 0.00% |
500,000
|
| 2009 Lincoln Silver Uncirculated* | 125,000 | 125,000 | 0 | 0.00% | |
| 2009 Braille Silver Proof | 111,311 | 112,735 | 1,424 | 1.28% | 400,000 |
| 2009 Braille Silver Uncirculated | 42,020 | 42,472 | 452 | 1.08% | |
| Braille Uncirculated in Easy-Open Capsule | 18,016 | 18,118 | 102 | 0.57% | |
| 2009 Quarters Silver Proof Set | 196,147 | 202,320 | 6,173 | 3.15% | none |
| 2008 Annual Uncirculated Dollar Coin Set | 67,267 | 68,214 | 947 | 1.41% |
none
|
| 2008 U.S. Mint Silver Proof Set | 767,121 | 769,787 | 2,666 | 0.35% |
none
|
*Coin products with an asterisk are no longer available. June 28 is the "as of date" for the most recent US Mint figures.
In other related news, silver eagle bullion sales surged in June. The month was the third best of the year for the coins. 13,824,500 have been sold during the first six months.
The previous reported sales figures are located at US Mint Silver Coin Sales Mixed with Highs and Lows. The Silver Coins Today tool page Mint Prices & Sales has been updated with the latest Mint sales figures.
![[Most Recent Quotes from www.kitco.com]](http://www.kitconet.com/images/quotes_2a.gif)


